You're probably looking at a dashboard right now that feels busy but not useful. Calls answered. Average handle time. Missed calls. Maybe a booking appointment metric from your front desk or service team. The numbers move every day, yet the hard question stays the same: what should you fix first?
That's the trap with contact center key performance indicators. Many teams collect plenty of data and still struggle to make better decisions. They react to whichever number looks worst, or they push one metric so hard that another one breaks. A team cuts call time, then first-call resolution slips. Another team speeds up answer times, then transfers rise and customers call back angry because the issue wasn't really solved.
For an SMB replacing a legacy phone system, this gets expensive fast. Old tools hide the full customer journey. One call starts with a phone tree, moves to a receptionist, gets transferred, ends without a clear disposition, and then comes back later as a “new” interaction. If your team books appointments, handles support, and fields sales inquiries in the same queue, bad measurement creates bad staffing, bad coaching, and bad customer experience.
The practical way to use KPIs is to treat them like diagnostic signals, not vanity metrics. A strong dashboard should tell you where customer friction starts, where agent effort spikes, and where demand could have been contained earlier through better routing, better knowledge, or better automation. That's when your contact center stops behaving like a cost center and starts protecting revenue, retention, and appointment conversion.
Beyond the Numbers What Your Contact Center Data Is Really Saying
A dashboard never tells the whole story by itself. It gives you symptoms.
When I review a contact center for an SMB owner, I usually find one of two situations. The first is obvious chaos: long queues, inconsistent coverage, dropped handoffs, and no confidence in reporting. The second is more dangerous. The dashboard looks respectable, but the operation is underperforming in quieter ways. Customers still repeat themselves. Agents still transfer too often. Appointment booking still depends on whoever happens to answer the phone.
Scoreboard thinking creates bad decisions
A scoreboard mindset asks, “Did this metric go up or down?” A diagnostic mindset asks, “What operational behavior caused that movement?”
Take a service business that wants more booked appointments. If the team only watches call volume and answer speed, it may miss a more important truth. The underlying problem may be that callers reached someone quickly but didn't get a confident answer, didn't trust the process, or weren't offered the next available booking appointment while they were still engaged.
KPIs become useful when they reveal friction in the customer journey, not when they simply prove the phones are ringing.
The same applies in support. A lower handle time can look like efficiency. Sometimes it is. Sometimes it means agents are rushing customers off the line, creating repeat demand that floods tomorrow's queue.
Good operators read the interaction chain
The most useful interpretation of contact center key performance indicators is sequential:
- Access tells you whether customers can reach you.
- Resolution tells you whether they leave with an answer.
- Experience tells you how the interaction felt.
- Outcome tells you whether the business got what it needed, such as a retained customer or a booked appointment.
If you read your data in that order, patterns get clearer. Fast answer time with low resolution points to a quality problem. Strong resolution with weak satisfaction often points to tone, effort, or wait friction. High booking appointment volume with messy follow-up often points to workflow failure after the call, not on the call.
That's the shift that matters. You don't need more metrics first. You need a better way to interpret the ones you already have.
The Foundational KPIs Every Contact Center Must Track
Many contact centers don't need a larger KPI library. They need a smaller one they trust. Start with four core measures: service level, first-call resolution, average handle time, and customer satisfaction. Together, they give you a practical view of access, quality, efficiency, and experience.
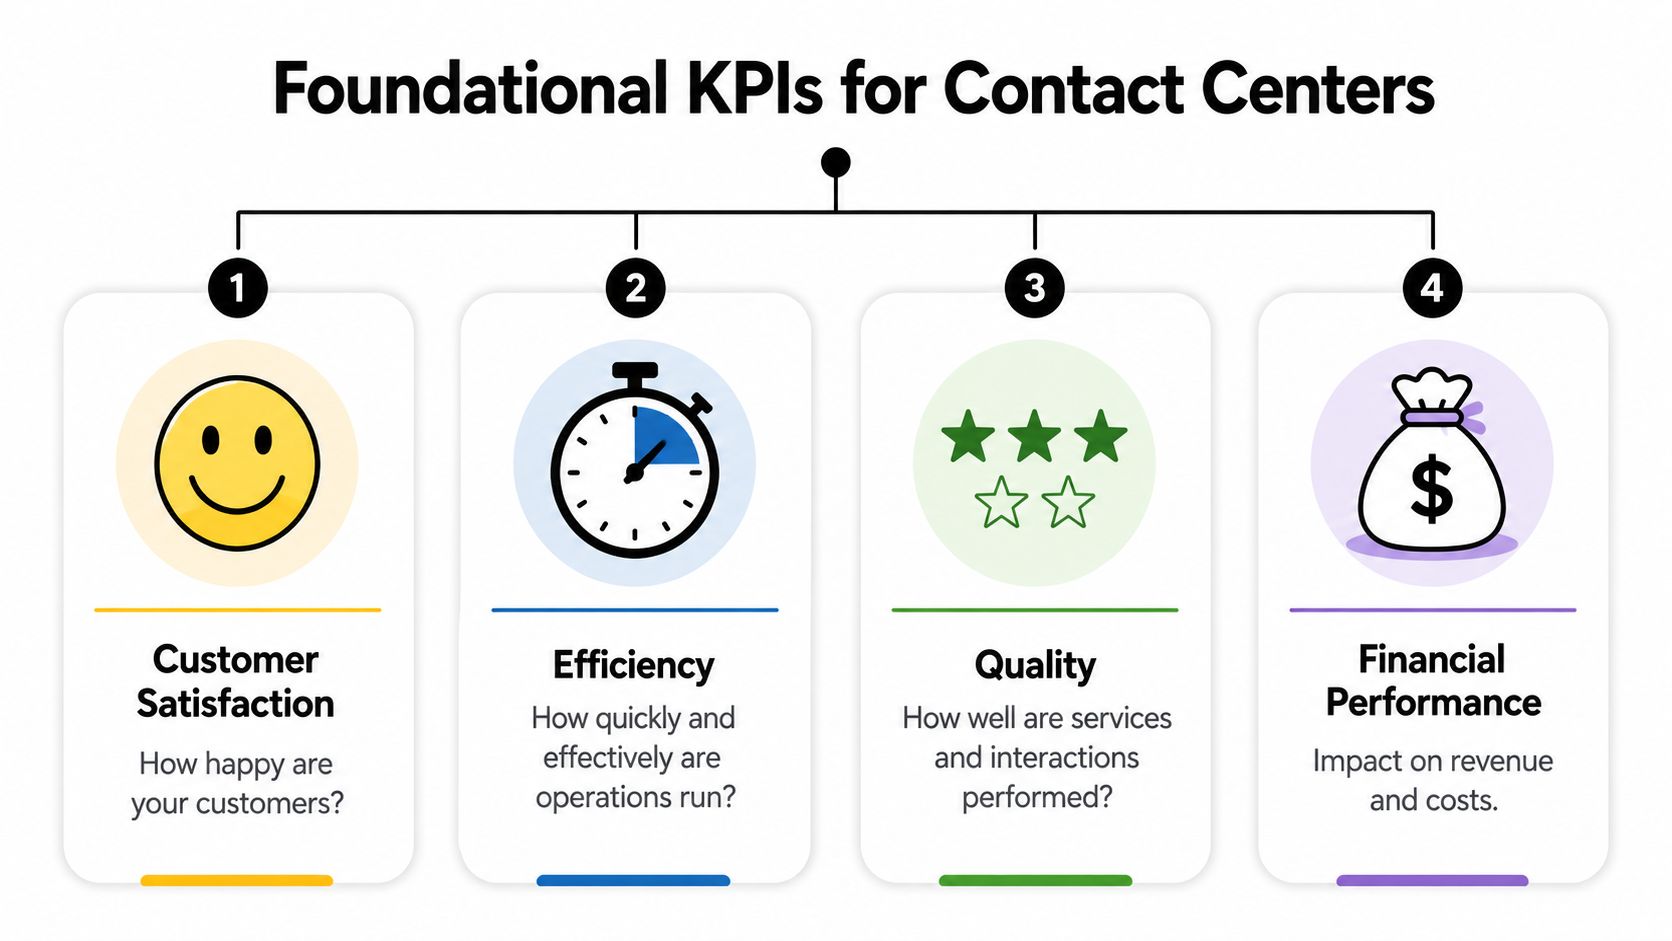
Service level shows whether customers can reach you in time
Service level measures the percentage of contacts answered within a target time. A commonly used benchmark is 80% of calls answered within 20 seconds, and a widely cited operating target is 99.9% system uptime to keep service available for customers and agents, as noted in Centrical's contact center KPI guide.
Think of service level as your front door. If customers can't get in, everything behind the door becomes irrelevant.
What it is
- Definition: The share of contacts answered within your target window.
- Operational role: A staffing and queue-health metric.
- Business meaning: It protects responsiveness, especially during peaks.
How to calculate it
- Formula: Contacts answered within target time ÷ total contacts offered
For an SMB, this matters beyond support. If you rely on inbound demand, poor service level means missed revenue, missed intake, and missed booking appointment opportunities.
First-call resolution shows whether you actually solved the problem
First-Call Resolution (FCR) measures the share of issues resolved in the initial interaction without follow-up. Industry guidance notes that many leaders treat it as a primary performance indicator, and standard formula variants include resolved on first attempt ÷ total calls received, or resolved on first attempt ÷ total first calls, according to Genesys on call center metrics and KPIs.
This is the KPI I watch most closely when the business wants cleaner operations, fewer repeat contacts, and less queue pressure.
What it is
- Definition: Whether the customer's need was completed on the first interaction.
- Why it matters: Higher FCR typically reduces repeat contacts and rework.
- Practical example: In a dental or healthcare practice, FCR often means the patient got the right answer and the booking appointment was completed correctly on the first attempt.
How to calculate it
- Formula option one: Resolved on first attempt ÷ total calls received
- Formula option two: Resolved on first attempt ÷ total first calls
Average handle time shows total workload, not just talk time
Average Handle Time (AHT) captures the full agent workload per interaction, including talk time, hold time, and after-call work. That makes it more useful than talk time by itself.
AHT is your workload meter. If it rises, your staffing model gets stressed even when call volume stays flat.
What it is
- Definition: The average total time an agent spends completing an interaction.
- Why it matters: It affects throughput, occupancy, and queue performance.
- Common mistake: Teams chase lower AHT without checking if resolution quality drops.
How to calculate it
- Formula: (Talk time + hold time + after-call work) ÷ total handled interactions
If your team handles intake, support, and booking appointment requests, AHT can expose where process friction lives. Long hold periods often point to weak knowledge access. Long after-call work usually points to poor documentation workflow.
Customer satisfaction tells you how the interaction felt
Customer Satisfaction (CSAT) is the perception check. It usually comes from post-interaction feedback and tells you whether customers felt helped, respected, and clear on the next step.
It's less about internal efficiency and more about whether the service experience built trust.
| KPI | Best use | What it reveals |
|---|---|---|
| Service level | Queue access | Can customers reach you quickly enough |
| FCR | Resolution quality | Did the issue end on first contact |
| AHT | Workload efficiency | How much effort each interaction consumed |
| CSAT | Customer perception | How the interaction felt to the customer |
Practical rule: If you can only clean up four metrics first, make them these four and make sure everyone uses the same definitions.
If you're moving off older telephony, a modern cloud contact center platform makes these metrics easier to track consistently because routing, queue events, recordings, and agent activity live in one system instead of scattered tools.
How to Measure KPIs Accurately Without Misleading Your Team
Bad definitions create fake performance. That happens more often than most managers realize.
A team says FCR is improving, but they only count phone outcomes and ignore the fact that customers often switch to another channel to finish the same issue. Another team says handle time is under control, but they only track talk time and leave out after-call work. In both cases, the dashboard looks cleaner than reality.

The most common measurement mistakes
The easiest way to mislead your team is to make the metric too narrow.
Watch for these errors
- Partial AHT tracking: If you exclude hold time or after-call work, you undercount actual workload.
- Loose FCR definitions: If “resolved” means the agent ended the call, not the customer's issue ended, your FCR is inflated.
- Bad disposition hygiene: If agents use inconsistent wrap-up codes, your trends become unreliable.
- Channel blindness: If a call turns into a callback, transfer, or message thread, the original interaction may not have been resolved at all.
According to Indeed's overview of call center KPIs, Average Handle Time includes talk time, hold time, and after-call work. The same guidance notes that when AHT rises, the same call volume consumes more agent minutes, which raises occupancy and can degrade service level if staffing and routing aren't adjusted.
That's why talk time alone is a poor management metric. It's too easy to manipulate and too weak diagnostically.
Measure the customer journey, not isolated events
FCR often calls for more discipline. The denominator matters. The resolution definition matters. The follow-up window matters. If your operation books appointments, you also need to decide whether a call counts as resolved only when the appointment is scheduled and confirmed, not merely “promised.”
If the customer hangs up still needing another call, another transfer, or another channel, that interaction wasn't resolved. It was deferred.
A practical measurement setup should include:
- A clear resolution standard for each call type
- Required disposition codes with simple agent choices
- Transfer tracking to identify avoidable handoffs
- Repeat-contact review so false positives don't pollute FCR
- Unified reporting across phone, agent, and follow-up activity
For most SMBs, modern onboarding is essential. A system can have strong features and still fail if codes, queues, and routing logic are configured poorly. A structured contact center onboarding process reduces that risk because it forces the team to define what counts as handled, resolved, transferred, and completed before reports start driving decisions.
Interpreting Conflicting KPIs How to Prioritize and Act
Conflicting KPIs are where real management starts.
AHT is down. Good. FCR is also down. Bad. What happened? Most dashboards won't tell you. They'll just present both numbers and leave you to guess. That's the gap many KPI articles leave open. As noted in RingCentral's discussion of call center metrics, a practical challenge in contact center management is deciding which KPI should be optimized first when metrics conflict, especially when lowering speed metrics can hurt resolution quality.
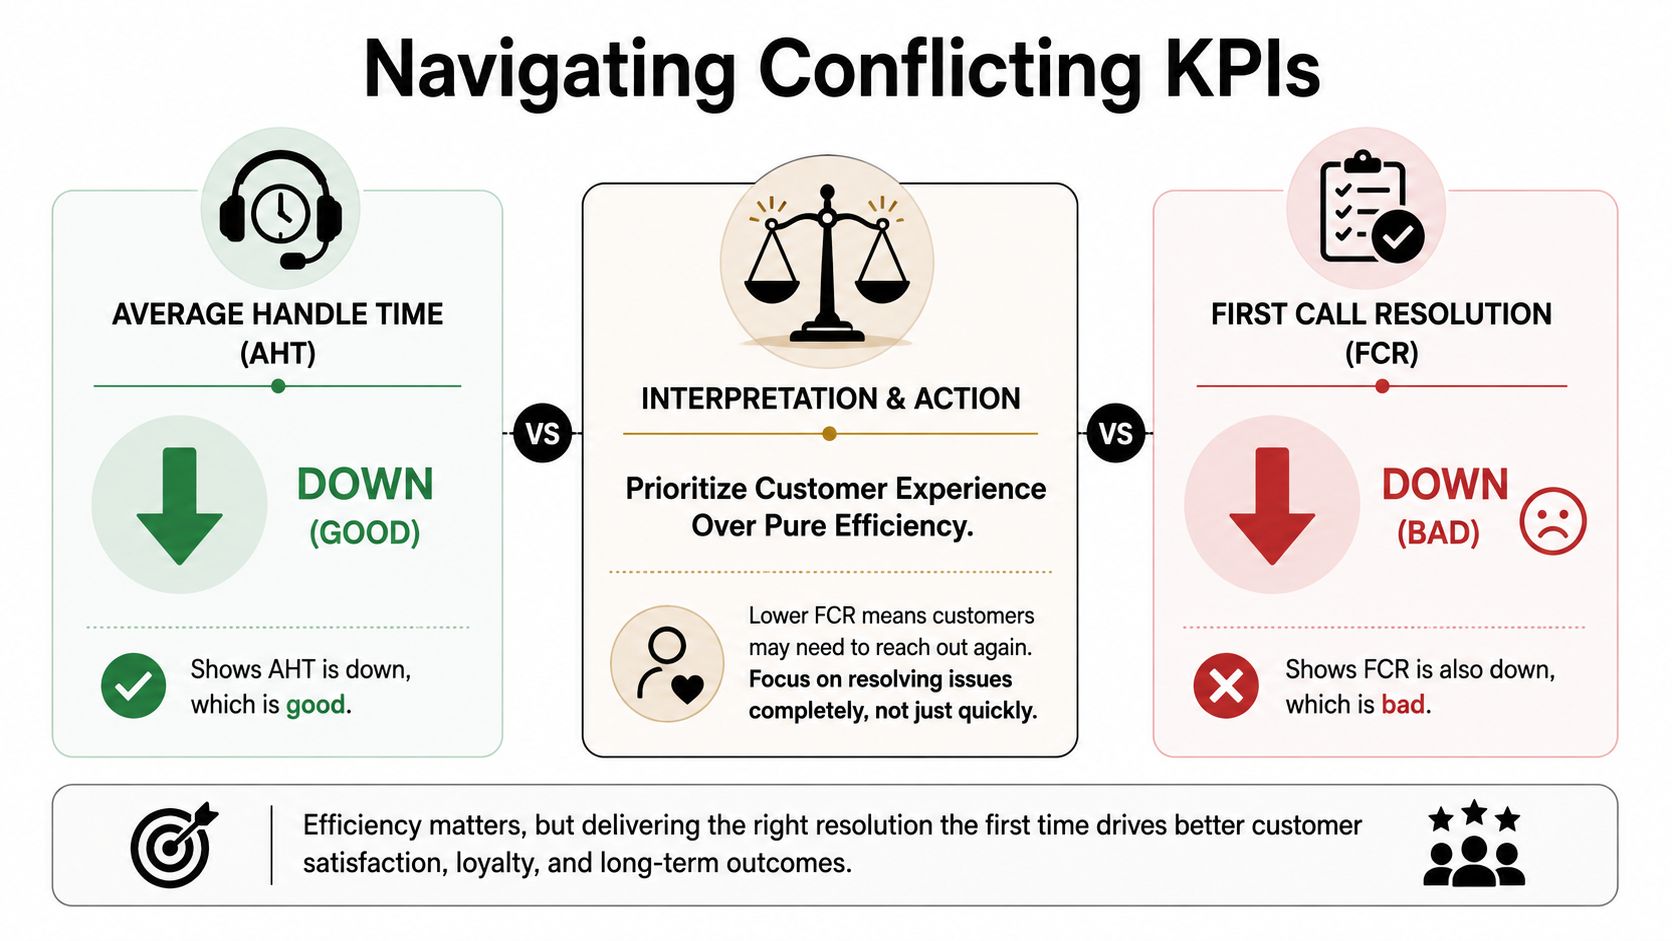
Start with business intent
Don't rank every KPI equally. The right hierarchy depends on what the center exists to do.
| Business priority | KPI to protect first | KPI to use as guardrail |
|---|---|---|
| Customer retention | FCR | AHT |
| High-volume support efficiency | Service level | CSAT |
| Revenue intake and booking appointment conversion | FCR | Service level |
| Regulated or sensitive interactions | Quality and compliance review | AHT |
If your business depends on getting callers scheduled, qualified, or retained, resolution quality usually deserves priority over raw speed. Fast failure is still failure.
A practical conflict example
Suppose a clinic or home services company changes scripting to move calls faster. AHT drops. Managers celebrate. Two weeks later, repeat contacts rise and front-desk staff report that many booking appointment requests weren't finished correctly.
That's not an efficiency win. It's unresolved demand pushed downstream.
Use this sequence to interpret the conflict:
- Check transfer behavior: If transfers climbed, agents may be exiting interactions faster by pushing work elsewhere.
- Review repeat contacts: If the same customer returns quickly, the first interaction probably didn't solve enough.
- Listen to call samples: Shorter calls can reveal rushed discovery, weak confirmation, or missing next steps.
- Compare outcomes by call reason: Billing, support, and booking appointment calls rarely behave the same way.
When one KPI improves by making another one worse, the “better” metric may be the misleading one.
Build a KPI hierarchy instead of chasing every number
Most SMBs benefit from a simple hierarchy:
- Primary KPI tied to the business outcome
- Secondary KPI that reflects operational support
- Guardrail KPI that prevents short-term gaming
For example, if you run a service business:
- Primary: FCR for inbound issues and booking appointment completion
- Secondary: Service level so customers can get through
- Guardrail: CSAT so rushed interactions don't count as success
If you run a cost-sensitive support center:
- Primary: Service level
- Secondary: AHT
- Guardrail: FCR so queue speed doesn't create repeat demand
This is the missing discipline in most discussions of contact center key performance indicators. The problem usually isn't that teams lack metrics. It's that they don't know which one gets veto power when the dashboard tells mixed stories.
Setting Achievable Targets with Industry Benchmarks
Most managers ask for benchmarks too early. They want to know whether their numbers are “good” before they've cleaned up definitions, routing, and reporting. That leads to bad target-setting.
Benchmarks are useful as orientation. They are not operating strategy.
The benchmark table most teams actually need
You asked for industry benchmarks by segment, but there's a practical limit here: precise ranges for healthcare, retail, and financial services weren't provided in the verified data, so presenting made-up ranges would be misleading. A better table is one that shows which KPI deserves extra emphasis by industry.
| Contact Center KPI Benchmarks by Industry | Healthcare / Dental | Retail / E-commerce | Financial Services |
|---|---|---|---|
| Service level | High importance because urgent patient and appointment demand can't wait | High importance during spikes, promotions, and order issues | High importance because customers often contact with time-sensitive account concerns |
| FCR | Very high importance because booking appointment accuracy and clear follow-up matter | High importance because repeat contacts increase workload quickly | Very high importance because incomplete answers increase friction and risk |
| AHT | Should be balanced carefully because some interactions require reassurance and detail | Often useful for staffing and throughput, but not at the expense of resolution | Best treated as a guardrail, since complex requests may need longer handling |
| CSAT | Strong indicator of trust and clarity | Useful for spotting friction in fulfillment and returns journeys | Useful for confidence, clarity, and service experience |
Use published benchmarks sparingly
There are only a few benchmark-style figures in the verified data that are safe to cite. One is the commonly used 80% of calls answered within 20 seconds service-level target from the Centrical reference already cited earlier. Another is the operating expectation around uptime, which affects availability but is not a coaching metric.
Everything else should be customized for your operation.
Set targets this way
- Start with call reasons: Separate support, sales, and booking appointment interactions.
- Use current baselines: Improve from your own stable baseline before chasing external norms.
- Add one guardrail: If you target speed, protect resolution. If you target resolution, protect satisfaction.
- Review by queue, not just by center: Mixed queues hide real problems.
A target is only useful if the team can influence it directly and the business can explain why it matters.
For SMBs, realistic targets beat generic “world-class” goals every time. A dental office, legal intake team, and e-commerce support desk may all answer phones, but they should not manage quality the same way.
Building a Dashboard and Tactics for KPI Improvement
At 10:15 a.m., the queue looks fine. By noon, wait times are climbing, agents are rushing calls, and tomorrow's volume is already being created through callbacks and unresolved cases. That is why a contact center dashboard has to do more than display activity. It has to support decisions.
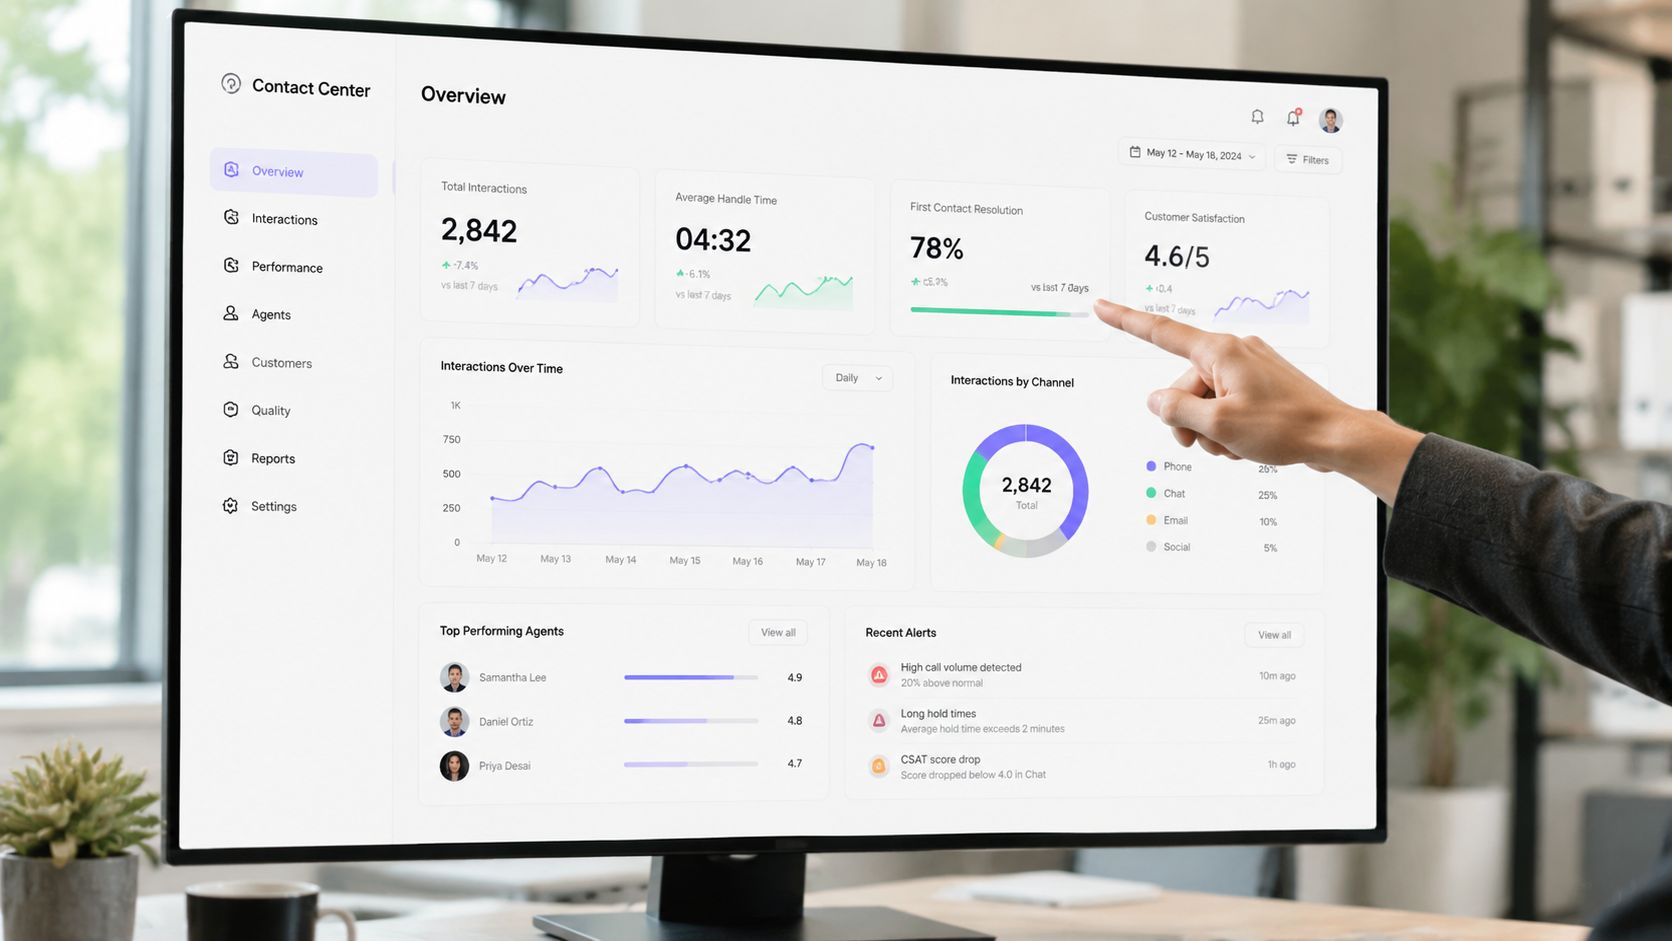
For an SMB, the right dashboard is not the one with the most widgets. It is the one that helps a manager answer three practical questions fast: What needs attention now? What needs coaching this week? What needs a process fix because coaching will not solve it?
What belongs on the dashboard
One screen should connect operational pressure to business outcomes. If speed drops, managers should be able to see whether that is a staffing issue, a routing issue, or a symptom of repeat contacts piling up. If handle time rises, they should be able to tell whether agents are doing more complete work or getting stuck in broken processes.
A useful dashboard usually includes these layers:
- Queue health: contacts waiting, answer performance, abandonment risk, and agent availability
- Resolution signals: FCR, repeat-contact patterns, and transfer rate
- Efficiency signals: AHT, hold time, and after-call work trends
- Quality and coaching flags: QA scores, compliance issues, and call types with recurring friction
- Business outcomes: appointments booked, leads qualified, payments taken, or cases closed
- Automation performance: what AI contained successfully, what escalated, and what created cleanup work for staff
The key is connection. A dashboard that shows service level without resolution encourages teams to work faster. A dashboard that shows AHT without quality encourages short calls that create another contact tomorrow. Good dashboard design makes those trade-offs visible.
Build the dashboard around decisions, not departments
I usually recommend splitting dashboard views by management horizon.
Real-time view
- Queue spikes
- Agent occupancy
- SLA risk
- Abandonment risk
- Escalation volume
Weekly coaching view
- FCR by agent and call reason
- Transfer patterns
- AHT by interaction type
- QA failures
- After-call work outliers
Monthly improvement view
- Repeat-contact drivers
- Process breakdowns by queue
- Routing accuracy
- Self-service containment quality
- Outcome completion by channel
This structure matters because the action is different in each case. Real-time metrics support staffing and intervention. Weekly metrics support coaching. Monthly metrics support process redesign, knowledge-base fixes, and workflow changes.
If all of that lives in one mixed view, teams either miss the problem or react to the wrong one.
Start improvement where KPI conflicts are costing you money
Many teams ask which KPI to improve first. The better question is where one KPI is hurting another.
For example, if answer speed looks strong but repeat contacts keep rising, the operation is likely protecting service level while sacrificing resolution. If AHT is falling but QA scores and transfers are getting worse, agents may be rushing or lacking the authority to finish the job. If automation containment is high but callbacks increase, the bot is ending interactions without completing the work.
For many SMBs, resolution is the best place to start because it improves both customer experience and workload. Better FCR reduces rework, lowers future contact volume, and gives agents more room to handle complex issues well.
Tactics that usually improve resolution without causing new problems
- Tighten routing rules: send contacts to the team most likely to finish the task on the first attempt
- Separate high-friction intents: billing, tech support, returns, and appointment booking need different workflows
- Reduce avoidable transfers: fix skill mapping, opening scripts, and ownership rules
- Shorten answer-finding time: give agents faster access to policies, account context, and next-step guidance
- Cut after-call burden: remove documentation steps that do not affect compliance, billing, or follow-up
- Review failed resolutions by call reason: broad averages hide the true source of repeat demand
Technology can help if it removes handoffs and gives managers cleaner data. A modern cloud contact center software platform can combine routing, recordings, analytics, agent states, and AI-assisted handling in one system. Options in this category, including platforms from providers such as Cloud Vision Technologies LLC, can reduce the reporting gaps that are common when SMBs are replacing older phone systems and bolt-on tools.
A short demo can make dashboard design easier to visualize:
Tactics that fail even when the dashboard looks good
Poor improvement plans usually fail for familiar reasons.
- Chasing one metric alone: teams learn how to protect the number, not improve the customer experience
- Managing from center-wide averages: averages hide broken queues, bad call types, and uneven routing
- Combining unlike work: sales, service, and appointment traffic need separate targets and separate coaching
- Treating coaching as the fix for process problems: agents cannot coach their way out of a broken policy or clumsy workflow
- Reviewing too late: if managers only look monthly, small problems become staffing pressure, lower quality, and missed revenue
The best dashboard supports action at the right level. Supervisors need fast signals they can intervene on today. Team leads need patterns they can coach this week. Owners and operators need enough clarity to decide whether to add staff, change routing, update workflows, or replace the system that is causing the problem.
Common Questions About Contact Center KPIs
What's the difference between a metric and a KPI
A metric is any measurement. A KPI is a measurement tied to a business objective. Call volume is a metric. FCR may be a KPI if your goal is reducing repeat contacts and improving booking appointment completion on the first interaction.
How often should I review contact center key performance indicators
Use different cadences for different decisions.
- Real time: queue health, staffing, and service risk
- Weekly: coaching trends, transfers, AHT patterns, and resolution quality
- Monthly: target resets, routing changes, and process redesign
If you review everything at the same cadence, you'll either overreact or react too late.
How should I measure AI agents and automated appointment booking
Track the same logic you use for human teams. Did the automation resolve the issue, contain the interaction appropriately, or complete the booking appointment without creating cleanup work for staff later?
For AI handling, focus on:
- Containment quality: which requests end successfully without unnecessary handoff
- Escalation quality: whether handoffs include enough context for the human agent
- Outcome completion: whether tasks such as appointment booking are fully completed, not partially captured
- Customer experience signals: whether callers get clear, low-effort service
If an automated flow creates callbacks, confusion, or duplicate work, it isn't saving the team time. It's just moving work around.
Cloud Vision Technologies LLC helps SMBs replace legacy phone systems with integrated cloud communications, including Hosted VoIP, an AI Voice Agent, and contact center software built for routing, analytics, and 24/7 appointment handling. If you want a practical way to align KPI tracking with day-to-day operations, explore Cloud Vision Technologies LLC.